Датотека:Phase diag iron carbon.PNG
Phase_diag_iron_carbon.PNG (409 × 379 пиксела, величина датотеке: 3 kB, MIME тип: image/png)
| Ово је датотека са Викимедијине оставе. Информације са њене странице са описом приказане су испод. Викимедијина остава је складиште слободно лиценциралних мултимедијалних датотека. И Ви можете да помогнете. |

|
Постоји и векторска верзија ове слике (у SVG формату).
Требало би је користити уместо ове битмап слике ако је боља. File:Phase diag iron carbon.PNG → File:Brosen ironcarbon.svg
За више информација о векторској графици, прочитајте Прелазак Оставе на SVG. Постоје и информације о подршци за SVG слике у Медијавикију. |
 |
An English version of Diag phase fer carbone.png, with grey tones cleaned up and some modification of text. Adaptation by Polyparadigm. Description of original image follows:
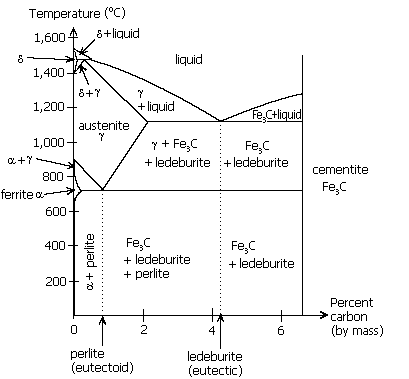
Iron-carbon phase diagram under atmospheric pressure
This diagram is limited by pure iron on the left and by iron carbide on the right. The mains phases are:
- α iron: ferrite, ferritic steel
- γ iron: austenite, austenitic steel
- iron carbide: cementite, Fe3C.
We can see an eutectic and an eutectoid; these phases crystallise as a stacking of fine strips of pure phases (iron and cementite) in case of the eutectoid, or a pure iron containing small balls of cementite for the eutectic. Although it is heterogeneous, these phases behave like homogeneous pure bodies.
Steel is between 0 and 2 mass percent of carbon. Cast iron is between 1,7 and 6,67%.
Author : Christophe Dang Ngoc Chan

|
Дата је дозвола да се копира, дистрибуира и/или мења овај документ под условима ГНУ-ове лиценце за слободну документацију, верзије 1.2 или било које новије верзије коју објави Задужбина за слободни софтвер; без непроменљивих одељака и без текста на насловној и задњој страни. Текст лиценце можете прочитати овде. |
| Ова датотека је доступна под лиценцом Creative Commons Ауторство-Делити под истим условима 3.0 Unported. | ||
| ||
| Ова лиценца је додата на ову датотеку као део ажурирања GFDL лиценце. |
derivative works
Derivative works of this file: Wykres zelazo wegiel.jpg
Историја датотеке
Кликните на датум/време да бисте видели тадашњу верзију датотеке.
| Датум/време | Минијатура | Димензије | Корисник | Коментар | |
|---|---|---|---|---|---|
| тренутна | 20:34, 9. јул 2005. | | 409 × 379 (3 kB) | Polyparadigm~commonswiki | An English version of Diag phase fer carbone.png, with grey tones cleaned up and some modification of text. Adaptation by Polyparadigm. Description of original image follows: ---- Iron-carbon phase diagram under atmospheric pressure This diag |
Употреба датотеке
Следећа страница користи ову датотеку:
Глобална употреба датотеке
Други викији који користе ову датотеку:
- Употреба на af.wikipedia.org
- Употреба на ar.wikipedia.org
- Употреба на bn.wikipedia.org
- Употреба на ca.wikipedia.org
- Употреба на ckb.wikipedia.org
- Употреба на en.wikipedia.org
- Употреба на es.wikipedia.org
- Употреба на fa.wikipedia.org
- Употреба на fi.wikipedia.org
- Употреба на gl.wikipedia.org
- Употреба на he.wikipedia.org
- Употреба на it.wikipedia.org
- Употреба на ja.wikipedia.org
- Употреба на pt.wikipedia.org
- Употреба на ru.wikipedia.org
- Употреба на sl.wikipedia.org
- Употреба на uz.wikipedia.org
- Употреба на vi.wikipedia.org
- Употреба на zh-min-nan.wikipedia.org