Датотека:Phase diag iron carbon.PNG
Phase_diag_iron_carbon.PNG (409 × 379 piksela, veličina datoteke: 3 kB, MIME tip: image/png)
| Ovo je datoteka sa Vikimedijine ostave. Informacije sa njene stranice sa opisom prikazane su ispod. Vikimedijina ostava je skladište slobodno licenciralnih multimedijalnih datoteka. I Vi možete da pomognete. |

|
Постоји и векторска верзија ове слике (у SVG формату).
Требало би је користити уместо ове битмап слике ако је боља. File:Phase diag iron carbon.PNG → File:Brosen ironcarbon.svg
За више информација о векторској графици, прочитајте Прелазак Оставе на SVG. Постоје и информације о подршци за SVG слике у Медијавикију. |
 |
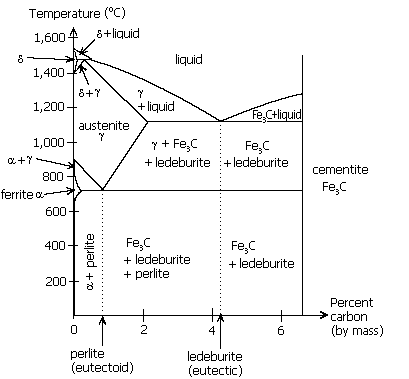
An English version of Diag phase fer carbone.png, with grey tones cleaned up and some modification of text. Adaptation by Polyparadigm. Description of original image follows:
Iron-carbon phase diagram under atmospheric pressure
This diagram is limited by pure iron on the left and by iron carbide on the right. The mains phases are:
- α iron: ferrite, ferritic steel
- γ iron: austenite, austenitic steel
- iron carbide: cementite, Fe3C.
We can see an eutectic and an eutectoid; these phases crystallise as a stacking of fine strips of pure phases (iron and cementite) in case of the eutectoid, or a pure iron containing small balls of cementite for the eutectic. Although it is heterogeneous, these phases behave like homogeneous pure bodies.
Steel is between 0 and 2 mass percent of carbon. Cast iron is between 1,7 and 6,67%.
Author : Christophe Dang Ngoc Chan

|
Data je dozvola da se kopira, distribuira i/ili menja ovaj dokument pod uslovima GNU-ove licence za slobodnu dokumentaciju, verzije 1.2 ili bilo koje novije verzije koju objavi Zadužbina za slobodni softver; bez nepromenljivih odeljaka i bez teksta na naslovnoj i zadnjoj strani. Tekst licence možete pročitati ovde. |
| Ova datoteka je dostupna pod licencom Creative Commons Autorstvo-Deliti pod istim uslovima 3.0 Unported. | ||
| ||
| Ova licenca je dodata na ovu datoteku kao deo ažuriranja GFDL licence. |
derivative works
Derivative works of this file: Wykres zelazo wegiel.jpg
Istorija datoteke
Kliknite na datum/vreme da biste videli tadašnju verziju datoteke.
| Datum/vreme | Minijatura | Dimenzije | Korisnik | Komentar | |
|---|---|---|---|---|---|
| trenutna | 20:34, 9. jul 2005. | | 409 × 379 (3 kB) | Polyparadigm~commonswiki | An English version of Diag phase fer carbone.png, with grey tones cleaned up and some modification of text. Adaptation by Polyparadigm. Description of original image follows: ---- Iron-carbon phase diagram under atmospheric pressure This diag |
Upotreba datoteke
Sledeća stranica koristi ovu datoteku:
Globalna upotreba datoteke
Drugi vikiji koji koriste ovu datoteku:
- Upotreba na af.wikipedia.org
- Upotreba na ar.wikipedia.org
- Upotreba na bn.wikipedia.org
- Upotreba na ca.wikipedia.org
- Upotreba na ckb.wikipedia.org
- Upotreba na en.wikipedia.org
- Upotreba na es.wikipedia.org
- Upotreba na fa.wikipedia.org
- Upotreba na fi.wikipedia.org
- Upotreba na gl.wikipedia.org
- Upotreba na he.wikipedia.org
- Upotreba na it.wikipedia.org
- Upotreba na ja.wikipedia.org
- Upotreba na pt.wikipedia.org
- Upotreba na ru.wikipedia.org
- Upotreba na sl.wikipedia.org
- Upotreba na uz.wikipedia.org
- Upotreba na vi.wikipedia.org
- Upotreba na zh-min-nan.wikipedia.org