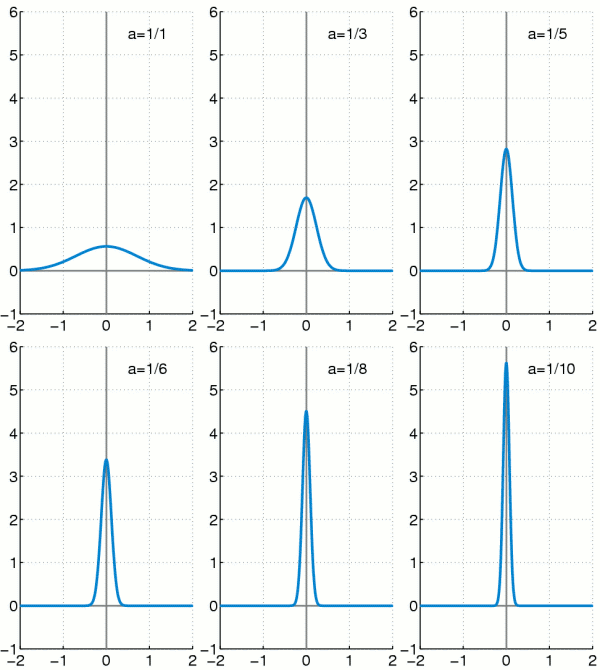
Датотека:Dirac function approximation.gif
Dirac_function_approximation.gif (200 × 335 пиксела, величина датотеке: 89 kB, MIME тип: image/gif, петља, 10 кадрова, 2,0 с)
Историја датотеке
Кликните на датум/време да бисте видели тадашњу верзију датотеке.
| Датум/време | Минијатура | Димензије | Корисник | Коментар | |
|---|---|---|---|---|---|
| тренутна | 00:51, 13. јануар 2008. |  | 200 × 335 (89 kB) | Oleg Alexandrov | tweak |
| 00:22, 13. јануар 2008. |  | 217 × 363 (99 kB) | Oleg Alexandrov | {{Information |Description=Illustration of approximating the Dirac delta function by gaussians. |Source=self-made with MATLAB |Date=~~~~~ |Author= Oleg Alexandrov |Permission= |other_versions= }} {{ |
Употреба датотеке
Следећа страница користи ову датотеку:
Глобална употреба датотеке
Други викији који користе ову датотеку:
- Употреба на ar.wikipedia.org
- Употреба на bg.wikipedia.org
- Употреба на bn.wikipedia.org
- Употреба на cs.wikipedia.org
- Употреба на da.wikipedia.org
- Употреба на de.wikipedia.org
- Употреба на el.wikipedia.org
- Употреба на en.wikipedia.org
- Употреба на en.wikibooks.org
- Употреба на fa.wikipedia.org
- Употреба на fi.wikipedia.org
- Употреба на fr.wikipedia.org
- Употреба на he.wikipedia.org
- Употреба на hi.wikipedia.org
- Употреба на hu.wikipedia.org
- Употреба на id.wikipedia.org
- Употреба на it.wikipedia.org
- Употреба на ka.wikipedia.org
- Употреба на ko.wikipedia.org
- Употреба на nl.wikipedia.org
- Употреба на no.wikipedia.org
- Употреба на pt.wikipedia.org
- Употреба на ro.wikipedia.org
- Употреба на simple.wikipedia.org
- Употреба на si.wikipedia.org
- Употреба на sl.wikipedia.org
- Употреба на sv.wikipedia.org
- Употреба на uk.wikipedia.org
- Употреба на vi.wikipedia.org
- Употреба на zh.wikipedia.org
