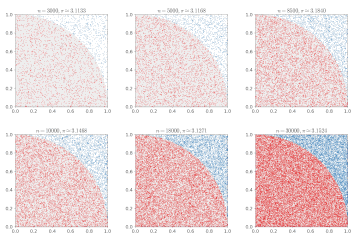
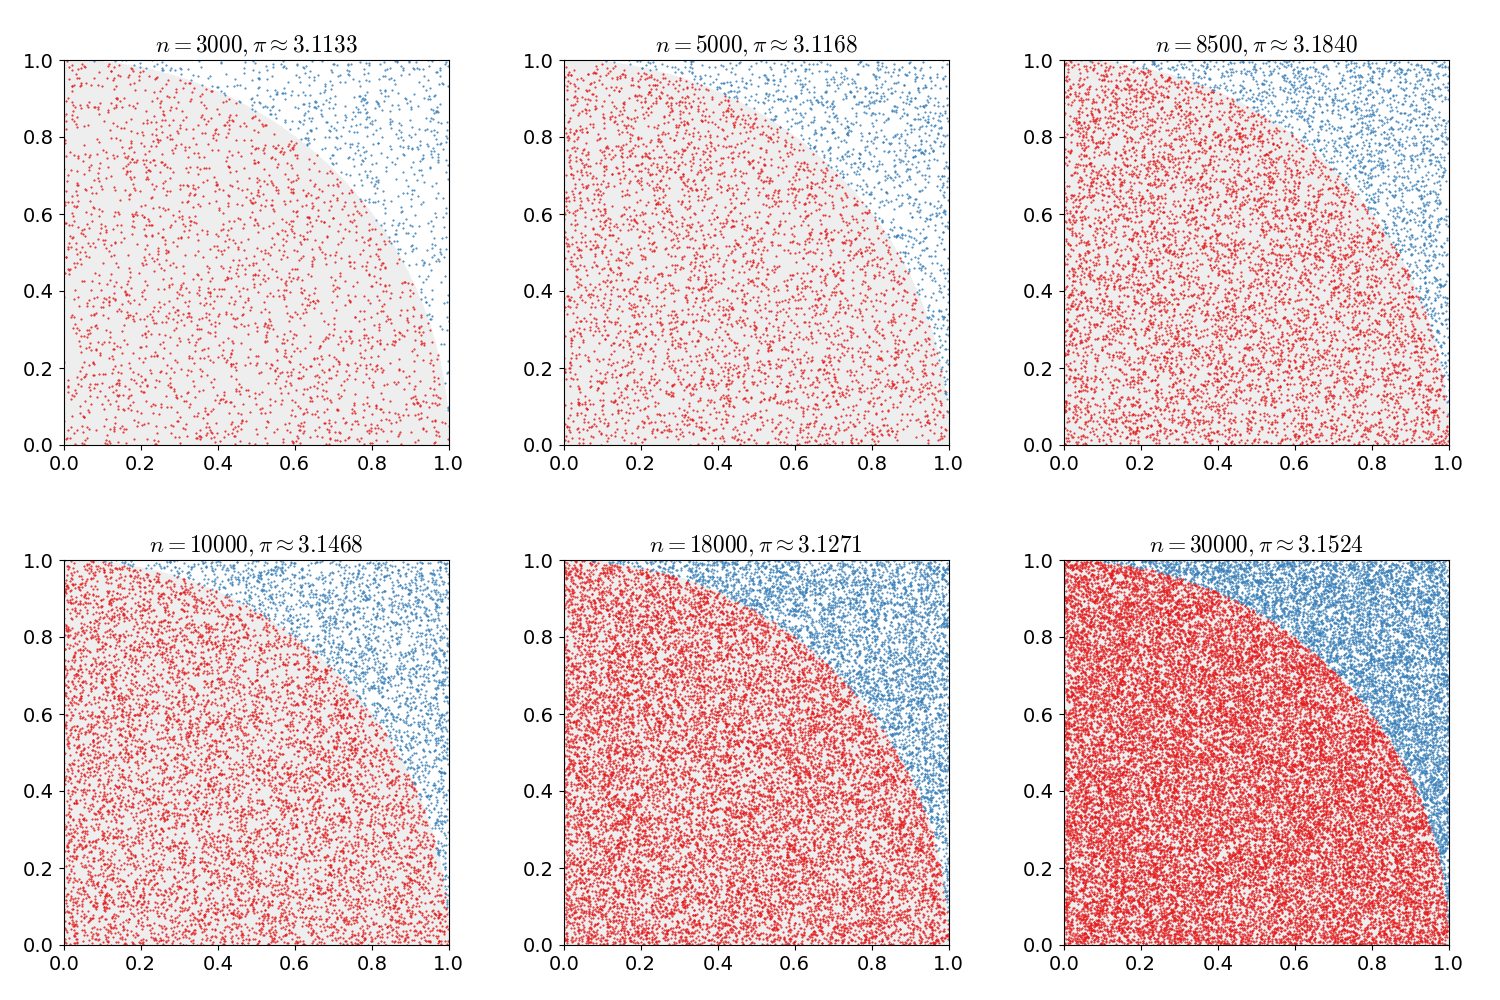
Датотека:Pi 30K.gif
Pi_30K.gif (500 × 500 пиксела, величина датотеке: 476 kB, MIME тип: image/gif, петља, 10 кадрова, 2,0 с)
Историја датотеке
Кликните на датум/време да бисте видели тадашњу верзију датотеке.
| Датум/време | Минијатура | Димензије | Корисник | Коментар | |
|---|---|---|---|---|---|
| тренутна | 18:00, 16. фебруар 2017. |  | 500 × 500 (476 kB) | Nicoguaro | Make the plot square and increase gif delay. |
| 17:38, 16. фебруар 2017. |  | 640 × 480 (476 kB) | Nicoguaro | Bigger text in the axes, and colors from ColorBrewer. Code in Python. | |
| 20:29, 7. новембар 2011. |  | 500 × 500 (373 kB) | Rayhem | Slowed animation to avoid looking like a blinky page element, improved resolution, added counter for number of points, shaded points inside/outside the circle. ==Mathematica 7.0 Source== <pre> tinyColor[color_, point_] := {PointSize[Small], color, Point[ | |
| 01:12, 15. март 2011. |  | 360 × 369 (363 kB) | CaitlinJo | {{Information |Description ={{en|1=As points are randomly scattered inside the unit square, some fall within the unit circle. The fraction of points inside the circle over all points approaches pi as the number of points goes toward infinity. This ani |
Употреба датотеке
Следећа страница користи ову датотеку:
Глобална употреба датотеке
Други викији који користе ову датотеку:
- Употреба на ar.wikipedia.org
- Употреба на be.wikipedia.org
- Употреба на bg.wikipedia.org
- Употреба на ca.wikipedia.org
- Употреба на da.wikipedia.org
- Употреба на el.wikipedia.org
- Употреба на en.wikipedia.org
- Употреба на en.wikibooks.org
- Употреба на eo.wikipedia.org
- Употреба на eu.wikipedia.org
- Употреба на fa.wikipedia.org
- Употреба на fr.wikipedia.org
- Употреба на he.wikipedia.org
- Употреба на hi.wikipedia.org
- Употреба на id.wikipedia.org
- Употреба на it.wikipedia.org
- Употреба на ja.wikipedia.org
- Употреба на ko.wikipedia.org
- Употреба на pt.wikipedia.org
- Употреба на sh.wikipedia.org
- Употреба на simple.wikipedia.org
- Употреба на sl.wikipedia.org
- Употреба на sv.wikipedia.org
- Употреба на ta.wikipedia.org
- Употреба на test.wikipedia.org
- Употреба на tr.wikipedia.org
- Употреба на uk.wikipedia.org
- Употреба на vi.wikipedia.org
- Употреба на www.wikidata.org
- Употреба на zh-yue.wikipedia.org
- Употреба на zh.wikipedia.org
