Gradient_descent.png(482 × 529 пиксела, величина датотеке: 25 kB, MIME тип: image/png)

Опис измене

Постоји и векторска верзија ове слике (у SVG формату).
Требало би је користити уместо ове битмап слике ако је боља.

File:Gradient descent.png → File:Gradient descent.svg

За више информација о векторској графици, прочитајте Прелазак Оставе на SVG.
Постоје и информације о подршци за SVG слике у Медијавикију.

Na drugim jezicima
Alemannisch  Bahasa Indonesia  Bahasa Melayu  British English  català  čeština  dansk  Deutsch  eesti  English  español  Esperanto  euskara  français  Frysk  galego  hrvatski  Ido  italiano  lietuvių  magyar  Nederlands  norsk bokmål  norsk nynorsk  occitan  Plattdüütsch  polski  português  português do Brasil  română  Scots  sicilianu  slovenčina  slovenščina  suomi  svenska  Tiếng Việt  Türkçe  vèneto  Ελληνικά  беларуская (тарашкевіца)  български  македонски  нохчийн  русский  српски / srpski  татарча/tatarça  українська  ქართული  հայերեն  বাংলা  தமிழ்  മലയാളം  ไทย  한국어  日本語  简体中文  繁體中文  עברית  العربية  فارسی  +/−
New SVG image

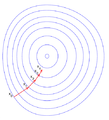
Опис An illustration of the gradient descent method. I graphed this with Matlab
Датум 19. новембар 2004. (првобитни датум слања)
Извор Пребачено са en.wikipedia на Оставу.
Аутор Olegalexandrov на енглески Википедија
 
This diagram was created with MATLAB.

Moved from en:Wikipedia, converted to png, and added the matlab source code. Oleg Alexandrov 03:33, 23 June 2007 (UTC)

Лиценцирање

Public domain Ја, творац овог дела, предајем га у јавно власништво. Ово се односи на цео свет.
У неким земљама, ово није законски могуће; у том случају:
Ја, творац овог дела дозвољавам свакоме да користи ово дело за било коју намену, без било каквих услова, осим услова које намеће закон.

Source code (MATLAB)


% Illustration of gradient descent
function main()

% the ploting window
   figure(1);
   clf; hold on;
   set(gcf, 'color', 'white');
   set(gcf, 'InvertHardCopy', 'off');
   axis equal; axis off;

% the box 
   Lx1=-2; Lx2=2; Ly1=-2; Ly2=2;

% the function whose contours will be plotted
   N=60; h=1/N;
   XX=Lx1:h:Lx2;
   YY=Ly1:h:Ly2;
   [X, Y]=meshgrid(XX, YY);
   f=inline('-((y+1).^4/25+(x-1).^4/10+x.^2+y.^2-1)');
   Z=f(X, Y);

% the contours
   h=0.3; l0=-1; l1=20;
   l0=h*floor(l0/h);
   l1=h*floor(l1/h);
   v=[l0:1.5*h:0 0:h:l1 0.8 0.888];
   [c,h] = contour(X, Y, Z, v, 'b'); 

% graphing settings
   small=0.08;
   small_rad = 0.01;
   thickness=1; arrowsize=0.06; arrow_type=2;
   fontsize=13;
   red = [1, 0, 0];
   white = 0.99*[1, 1, 1];

% initial guess for gradient descent
   x=-0.6498; y=-1.0212;

   % run several iterations of gradient descent
   for i=0:4
      H=text(x-1.5*small, y+small/2, sprintf('x_%d', i));
      set(H, 'fontsize', fontsize, 'color', 0*[1 1 1]);

     % the derivatives in x and in y, the step size
      u=-2/5*(x-1)^3-2*x;
      v=-4/25*(y+1)^3-2*y;
      alpha=0.11;
      
      if i< 4
	 plot([x, x+alpha*u], [y, y+alpha*v]);
	 arrow([x, y], [x, y]+alpha*[u, v], thickness, arrowsize, pi/8, ...
	       arrow_type, [1, 0, 0])
	 x=x+alpha*u; y=y+alpha*v;
      end
      
   end
   
% some dummy text, to expand the saving window a bit
   text(-0.9721, -1.5101, '*', 'color', white);
   text(1.5235,   1.1824, '*', 'color', white);
   
% save to eps
   saveas(gcf, 'Gradient_descent.eps', 'psc2')

function arrow(start, stop, thickness, arrow_size, sharpness, arrow_type, color)

% Function arguments:
% start, stop:  start and end coordinates of arrow, vectors of size 2
% thickness:    thickness of arrow stick
% arrow_size:   the size of the two sides of the angle in this picture ->
% sharpness:    angle between the arrow stick and arrow side, in radians
% arrow_type:   1 for filled arrow, otherwise the arrow will be just two segments
% color:        arrow color, a vector of length three with values in [0, 1]

% convert to complex numbers
   i=sqrt(-1);
   start=start(1)+i*start(2); stop=stop(1)+i*stop(2);
   rotate_angle=exp(i*sharpness);

% points making up the arrow tip (besides the "stop" point)
   point1 = stop - (arrow_size*rotate_angle)*(stop-start)/abs(stop-start);
   point2 = stop - (arrow_size/rotate_angle)*(stop-start)/abs(stop-start);

   if arrow_type==1 % filled arrow

% plot the stick, but not till the end, looks bad
      t=0.5*arrow_size*cos(sharpness)/abs(stop-start); stop1=t*start+(1-t)*stop;
      plot(real([start, stop1]), imag([start, stop1]), 'LineWidth', thickness, 'Color', color);

% fill the arrow
      H=fill(real([stop, point1, point2]), imag([stop, point1, point2]), color);
      set(H, 'EdgeColor', 'none')

   else % two-segment arrow
      plot(real([start, stop]), imag([start, stop]),   'LineWidth', thickness, 'Color', color);
      plot(real([stop, point1]), imag([stop, point1]), 'LineWidth', thickness, 'Color', color);
      plot(real([stop, point2]), imag([stop, point2]), 'LineWidth', thickness, 'Color', color);
   end

function ball(x, y, r, color)
   Theta=0:0.1:2*pi;
   X=r*cos(Theta)+x;
   Y=r*sin(Theta)+y;
   H=fill(X, Y, color);
   set(H, 'EdgeColor', 'none');
Првобитан дневник отпремања

Оригиналан опис странице је био овде. Сва наведена корисничка имена воде на en.wikipedia.
  • 2004-11-19 02:41 Olegalexandrov 471×492×8 (27067 bytes) An illustration of the gradient descent method. I graphed this with Matlab {{PD}}

Натписи

Укратко шта ова датотека представља/приказује

Ставке приказане у овој датотеци

приказује

19. новембар 2004

Историја датотеке

Кликните на датум/време да бисте видели тадашњу верзију датотеке.

Датум/времеМинијатураДимензијеКорисникКоментар
тренутна05:33, 23. јун 2007.Минијатура за верзију на дан 05:33, 23. јун 2007.482 × 529 (25 kB)Oleg Alexandrov{{Information |Description=An illustration of the gradient descent method. I graphed this with Matlab |Source=Originally from [http://en.wikipedia.org en.wikipedia]; description page is/was [http://en.wikipedia.org/w/index.php?title=Image%3AGradient_desce

Нема страница које користе ову датотеку.

Глобална употреба датотеке

Други викији који користе ову датотеку: