Датотека:Light wave harmonic diagram.svg

Величина PNG прегледа за ову SVG датотеку је 426 × 331 пиксела. 5 других резолуција: 309 × 240 пиксела | 618 × 480 пиксела | 989 × 768 пиксела | 1.280 × 995 пиксела | 2.560 × 1.989 пиксела.
Оригинална датотека (SVG датотека, номинално 426 × 331 пиксела, величина: 172 kB)
| Ово је датотека са Викимедијине оставе. Информације са њене странице са описом приказане су испод. Викимедијина остава је складиште слободно лиценциралних мултимедијалних датотека. И Ви можете да помогнете. |
Опис измене
| Опис |
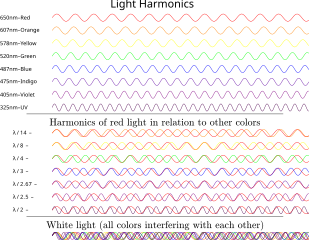
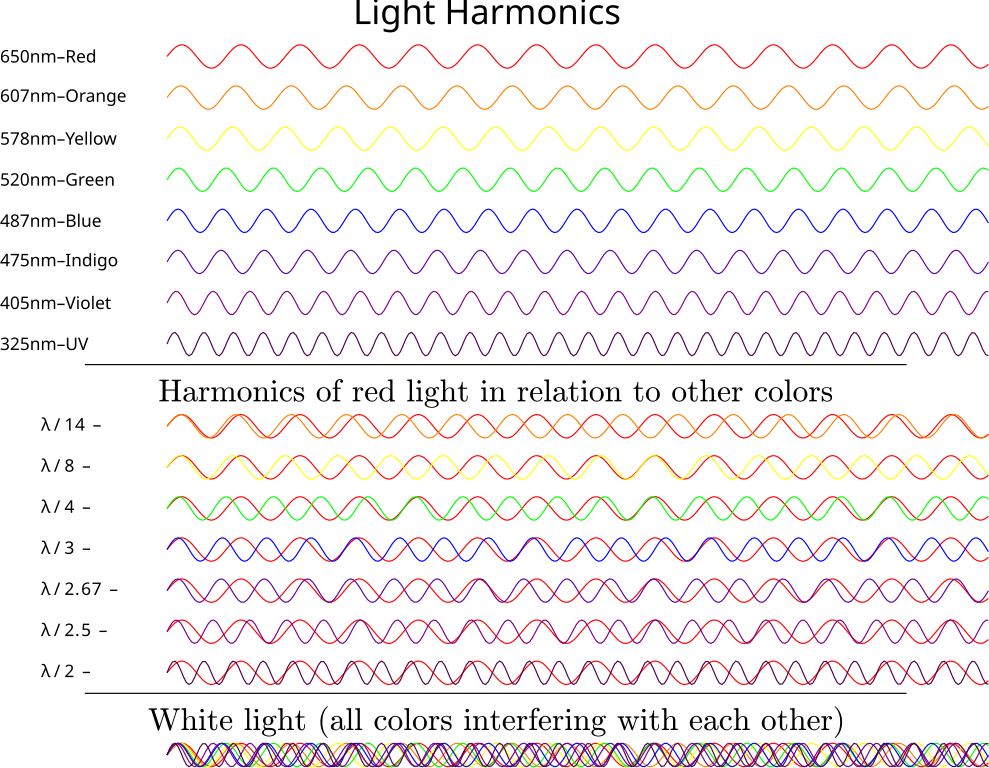
English: The harmonics of lightwaves drawn to scale, showing how the different waves interact with each other. The λ/2 (1/2 wavelength) harmonics are perfectly in sync with each other, but all other colors in the visual spectrum fall between λ and λ/2. Wavelengths that are separated by λ/4 are opposites, falling across from each other on the color wheel. (ie: Red is opposite of green, orange is opposite of blue, and yellow is opposite of violet.) Image was generated using Tikz and the resulting PDF was converted to SVG. |
||
| Датум | |||
| Извор | Сопствено дело | ||
| Аутор | Rubber Duck (☮ • ✍) | ||
| SVG genesis | This vector image was created with LaTeX.
| ||
| Изворни код | SVG code
|

Лиценцирање
Ја, носилац ауторских права над овим делом, објављујем исто под следећим лиценцама:
Ова датотека је доступна под лиценцом Creative Commons Ауторство-Делити под истим условима 3.0 Unported.
- Дозвољено је:
- да делите – да умножавате, расподељујете и преносите дело
- да прерађујете – да прерадите дело
- Под следећим условима:
- ауторство – Морате да дате одговарајуће заслуге, обезбедите везу ка лиценци и назначите да ли су измене направљене. Можете то урадити на било који разуман манир, али не на начин који предлаже да лиценцатор одобрава вас или ваше коришћење.
- делити под истим условима – Ако измените, преобразите или доградите овај материјал, морате поделити своје доприносе под истом или компатибилном лиценцом као оригинал.

|
Дата је дозвола да се копира, дистрибуира и/или мења овај документ под условима ГНУ-ове лиценце за слободну документацију, верзије 1.2 или било које новије верзије коју објави Задужбина за слободни софтвер; без непроменљивих одељака и без текста на насловној и задњој страни. Текст лиценце можете прочитати овде. |
Изаберите лиценцу по жељи.
Историја датотеке
Кликните на датум/време да бисте видели тадашњу верзију датотеке.
| Датум/време | Минијатура | Димензије | Корисник | Коментар | |
|---|---|---|---|---|---|
| тренутна | 17:28, 19. септембар 2017. | | 426 × 331 (172 kB) | Krishnavedala | recreated file with editable text using "latex" and "dvisvgm" |
| 17:43, 22. април 2015. |  | 427 × 331 (147 kB) | Krishnavedala | better rendering using "dvisvgm". unicode characters replaced by hand | |
| 21:40, 6. април 2015. |  | 434 × 338 (295 kB) | Krishnavedala | {{Information |Description ={{en|1=The harmonics of lightwaves drawn to scale, showing how the different waves interact with each other. The λ/2 (1/2 wavelength) harmonics are perfectly in sync with each other, but all other colors in the visual sp... |
Употреба датотеке
Следећа страница користи ову датотеку:
Глобална употреба датотеке
Други викији који користе ову датотеку:
- Употреба на ar.wikipedia.org
- Употреба на cs.wikipedia.org
- Употреба на fa.wikipedia.org
- Употреба на fa.wikibooks.org
- Употреба на gl.wikipedia.org
- Употреба на www.wikidata.org
- Употреба на zh.wikipedia.org